Smoothing ATR bandThere are two bands calculated with the ATR and I added "Smoothing" into the script.
Smoothing ATR with multiplier can display two bands above and below the price.
We can ONLY find some ATR bands in Community Scripts with "Basic" setting which is used to set Stop Loss.
And yet , Smoothing ATR with multiplier is capable of making traders manifestly recognize OverBought & OverSold.
FurtherMore, I added a condition with "plotshape", which is "Stop Hunt"
Stop Hunt is an absolutely usual strategy to clean the leverage and it always makes high volatility moves.
When high> above band and close< above band , long signal, it means it had been abundantly bought but the larger traders weren't satisfied; therefore, they quickly sold out to lower the price. The sell condition is on the contrary.
The signals mainly make traders manifestly recognize OverBought & OverSold.
在脚本中搜索"stop hunt"

Quantum Ribbon Lite📊 WHAT IS IT?
Quantum Ribbon Lite is a trend trading indicator built on a 5-layer exponential moving average ribbon system. It analyzes price momentum, volume, and ribbon alignment to generate entry signals with pre-calculated stop loss and take profit levels.
The indicator is designed for traders who want a straightforward approach to trend trading without managing complex configurations.
🔧 HOW IT WORKS
The Ribbon System
The indicator uses 5 pairs of EMAs (10 moving averages total) that create colored "clouds" on your chart:
Blue/Teal ribbons indicate bullish alignment
Red/Pink ribbons indicate bearish alignment
Mixed colors indicate neutral or transitional periods
The ribbon spacing automatically adjusts from a fast EMA (21) to a slow EMA (60), creating layers that show trend strength and direction.
Signal Generation
Signals appear when multiple conditions align:
For LONG signals:
Fast EMAs are above slow EMAs
Price momentum is positive and strong (> 0.5 ATR)
Volume is above average (> 1.1x average)
Ribbon confirms bullish state
Minimum confidence threshold met (filters weak setups)
For SHORT signals:
Fast EMAs are below slow EMAs
Price momentum is negative and strong
Volume is above average
Ribbon confirms bearish state
Minimum confidence threshold met
📈 VISUAL COMPONENTS
Entry Signals
Green "BUY" label = Long entry signal at candle close
Red "SELL" label = Short entry signal at candle close
Signals only trigger on confirmed candle closes (no repainting).
Risk Management Lines
Three lines appear when you have an active position:
White dotted line = Entry price
Red dotted line = Stop loss level
Green dotted line = Take profit target
Performance Dashboard
The stats table shows:
Current position status (In Long/Short or Waiting for signal)
Entry, stop, and target prices when in a trade
Win/loss record
Win rate percentage with color coding
⚙️ SETTINGS
1. Signal Sensitivity (1-10)
Controls the minimum time between signals (cooldown period):
1 = 2 bars between signals (most frequent)
5 = 10 bars between signals (balanced)
10 = 20 bars between signals (most selective)
Lower values generate more signals, higher values filter for better setups.
2. Stop Loss Distance
Determines how stops are calculated using ATR (Average True Range):
Tight = 1.5x ATR from entry
Normal = 2.0x ATR from entry
Wide = 2.5x ATR from entry
ATR adapts to market volatility, so stops are tighter in calm markets and wider in volatile markets.
3. Take Profit Target
Sets your risk-to-reward ratio:
1.5R = Target is 1.5 times your risk
2R = Target is 2 times your risk
3R = Target is 3 times your risk
Example: With a $100 stop distance and 2R setting, your take profit will be $200 away from entry.
4. Show Stats Table
Toggle to show/hide the performance dashboard in the top-right corner.
5. Show Risk Lines
Toggle to show/hide the entry/stop/target lines on the chart.
📋 HOW TO USE
Step 1: Apply to Chart
Add the indicator to your preferred instrument and timeframe (daily recommended).
Step 2: Wait for Signal
A BUY or SELL label will appear on the chart when conditions align.
Step 3: Enter Position
Enter at the close of the signal candle in the indicated direction.
Step 4: Set Risk Parameters Use the displayed lines:
Red line = Your stop loss
Green line = Your take profit
Step 5: Hold Position
Wait for the position to hit either the stop or target. No new signals will appear while you're in a position.
Step 6: Review Results
Check the stats table to track your win rate and adjust settings if needed.
🎯 RISK MANAGEMENT
Stop Loss Calculation
Stops are based on ATR (Average True Range) which measures recent price volatility:
In quiet markets: Stops are placed closer to entry
In volatile markets: Stops are placed further away
This adaptive approach helps prevent stop-hunting while maintaining appropriate risk levels.
Take Profit Calculation
Targets are calculated as a multiple of your stop distance:
If stop is 50 points away and you use 2R, target is 100 points away
Maintains consistent risk-reward ratios across all trades
Required Win Rates To break even after fees:
1.5R requires ~40% win rate
2R requires ~34% win rate
3R requires ~25% win rate
📊 RECOMMENDED USAGE
Timeframes:
Daily charts show strongest performance in testing
4H and 1H timeframes work but may have lower win rates
Lower timeframes generate more signals but reduced quality
Markets:
Works on all instruments: Stocks, Forex, Crypto, Futures, Indices
Best suited for trending markets
May generate false signals in tight ranges or choppy conditions

Volume Profile DeltaMap [MHA Finverse]Volume Profile DeltaMap with Session Analysis
SHORT DESCRIPTION (for listing)
Advanced Volume Profile indicator with Delta Analysis, Value Area, Volume Nodes, Imbalance Zones, and Multi-Session Profiles. Professional tool for institutional-style volume analysis and market structure understanding.
---
DETAILED DESCRIPTION
📊 OVERVIEW
The Volume Profile DeltaMap is a comprehensive institutional-grade indicator that visualizes volume distribution across price levels, revealing where the most significant trading activity occurred. Unlike traditional indicators that plot data over time, Volume Profile analyzes price levels to identify key support/resistance zones, equilibrium areas, and buyer/seller dominance.
This indicator combines multiple advanced features:
- Volume Profile Analysis with customizable bins
- Delta Heat Map showing buyer vs seller pressure
- Value Area (VAH/VAL) calculations
- High/Low Volume Node Detection
- Imbalance Zone Identification
- Multi-Session Profile Separation (Tokyo, London, NY, Sydney)
- Point of Control (POC) highlighting
---
🎯 KEY FEATURES
1. Volume Profile Core
- Divides price range into customizable bins (10-100 levels)
- Accumulates volume at each price level over a lookback period
- Displays volume distribution horizontally on the chart
- Configurable lookback period (default: 200 bars)
2. Delta Analysis & Heat Map
- Delta (Δ) : Measures the difference between buying and selling pressure
- Color-coded visualization :
- Green/Teal = Buyer dominance
- Red/Pink = Seller dominance
- Heat map intensity : Shows volume concentration with gradient colors
- Percentage labels : Displays exact buyer/seller ratios at each level
3. Point of Control (POC)
- Automatically identifies the price level with maximum volume
- Marked with cyan border and volume label
- Acts as a strong magnetic level where price tends to return
- Often serves as major support/resistance
4. Value Area (VAH/VAL)
- Value Area : Price range containing 70% of total volume (configurable 50-90%)
- VAH (Value Area High) : Upper boundary - resistance level
- VAL (Value Area Low) : Lower boundary - support level
- Displayed with dashed lines and labels
- Represents fair value zone where institutional traders are most active
5. Volume Nodes
- HVN (High Volume Nodes) : Areas with ≥80% of maximum volume
- Highlighted in yellow/amber
- Strong support/resistance zones
- Price tends to consolidate here
- LVN (Low Volume Nodes) : Areas with ≤30% of maximum volume
- Highlighted in orange
- Low liquidity gaps
- Price moves quickly through these zones
- Potential breakout areas
6. Imbalance Zones
- Identifies areas with extreme directional bias (≥70% threshold)
- Buy Imbalance : Green overlay - exhaustion of buying pressure
- Sell Imbalance : Red overlay - exhaustion of selling pressure
- Indicates potential reversal or continuation zones
7. Session-Based Analysis
- Session Background Overlay : Color-codes current trading session
- Separate Session Profiles : Creates individual volume profiles for:
- 🇯🇵 Tokyo Session (00:00-09:00)
- 🇬🇧 London Session (07:00-16:00)
- 🇺🇸 New York Session (13:00-22:00)
- 🇦🇺 Sydney Session (21:00-06:00)
- Compare volume patterns across different market sessions
- Identify session-specific support/resistance levels
---
⚙️ CONFIGURATION SETTINGS
Basic Settings
- LookBack : Number of bars to analyze (50-500 recommended)
- Bins : Number of price levels (10-100, default: 30)
- Horizontal Offset : Adjust profile position on chart
#### Features Toggle
- Delta Heat Map
- Delta Labels
- Volume Bars (Buy/Sell split)
- POC Line
- Custom colors for positive/negative volume
Advanced Features
- Value Area calculation with adjustable percentage
- Volume Nodes (HVN/LVN) with custom thresholds
- Imbalance Zones with adjustable sensitivity
- Session backgrounds and separate profiles
- Profile spacing for multi-session view
---
📈 HOW TO USE THIS INDICATOR
Installation & Setup
1. Add to Chart :
- Search for "Volume Profile DeltaMap"
- Click "Add to favorites" ⭐
- Apply to your chart
2. Recommended Timeframes :
- Scalping : 1-5 minute charts
- Day Trading : 5-15 minute charts
- Swing Trading : 1-4 hour charts
- Position Trading : Daily charts
3. Initial Settings :
- Start with default settings
- For intraday: Set LookBack to 200-400 bars
- For higher timeframes: Use 100-200 bars
4. Enable Session Profiles (Optional):
- Go to Settings → Advanced Features
- Enable "Separate Profiles Per Session"
- Adjust "Profile Spacing" for better visibility
---
🔍 READING THE INDICATOR
Understanding the Display
Main Profile Elements:
- Horizontal bars : Length represents volume at that price
- Color gradient : Shows delta (buyer vs seller dominance)
- Bright cyan line : Point of Control (POC) - highest volume
- Green dashed line : Value Area High (VAH)
- Red dashed line : Value Area Low (VAL)
- Yellow highlights : High Volume Nodes (HVN)
- Orange highlights : Low Volume Nodes (LVN)
Volume Bars (if enabled):
- Top half (Red) : Selling volume percentage
- Bottom half (Teal) : Buying volume percentage
Delta Labels:
- Shows Δ percentage
- Positive = More buyers
- Negative = More sellers
---
📊 MARKET ANALYSIS & TRADING STRATEGIES
1. Support & Resistance Trading
POC as Key Level:
- Price tends to return to POC (magnetic effect)
- Strategy :
- When price is above POC → Look for pullbacks to POC for long entries
- When price is below POC → Look for rallies to POC for short entries
- POC acts as dynamic support/resistance
Value Area Trading:
- Inside Value Area (between VAH & VAL):
- Market is in balance/equilibrium
- Range-bound trading strategies
- Look for mean reversion
- Outside Value Area :
- Price accepted above VAH = Bullish breakout
- Price accepted below VAL = Bearish breakdown
- Trend-following strategies
Example Setup:
Price above VAH + Strong buying delta = Bullish trend
→ Wait for pullback to VAH
→ Enter long with stop below VAH
→ Target: Next HVN or previous session high
2. Volume Node Trading
High Volume Nodes (HVN):
- Characteristics : Strong support/resistance, consolidation zones
- Trading Strategy :
- Price approaching HVN from above → Potential support
- Price approaching HVN from below → Potential resistance
- Breakout from HVN → Strong momentum move
- Setup : Place limit orders at HVN boundaries
Low Volume Nodes (LVN):
- Characteristics : Low liquidity, fast price movement
- Trading Strategy :
- Price in LVN = Don't chase, wait for next HVN
- LVN breakout = Rapid moves, use wider stops
- Price rejection from LVN = Quick return to HVN
- Setup : Avoid placing stops in LVN zones
Example:
Price consolidating at HVN (yellow) near $50,000
→ Breakout above with volume
→ Fast move through LVN (orange) gap
→ Next target: Upper HVN at $51,500
3. Delta Analysis for Entry Timing
Strong Buying Delta (Green zones):
- Δ > +20% = Buyers in control
- Bullish Signal : Accumulation zone
- Strategy : Look for long entries on pullbacks
- Confirmation : Rising price + positive delta
Strong Selling Delta (Red zones):
- Δ < -20% = Sellers in control
- Bearish Signal : Distribution zone
- Strategy : Look for short entries on rallies
- Confirmation : Falling price + negative delta
Delta Divergence (Advanced):
- Bullish Divergence : Price making lower lows, but delta improving (less negative)
- Indicates selling pressure weakening
- Potential reversal signal
- Bearish Divergence : Price making higher highs, but delta weakening (less positive)
- Indicates buying pressure exhausting
- Potential reversal signal
4. Imbalance Zone Trading
Buy Imbalance (Bright Green):
- 70%+ buying pressure
- Interpretation :
- Potential exhaustion of buyers
- Smart money distribution
- Strategy :
- Look for reversal signals (bearish candles, resistance)
- Take profits on long positions
- Consider short entries with confirmation
Sell Imbalance (Bright Red):
- 70%+ selling pressure
- Interpretation :
- Potential exhaustion of sellers
- Smart money accumulation
- Strategy :
- Look for reversal signals (bullish candles, support)
- Take profits on short positions
- Consider long entries with confirmation
Example:
```
Price at VAH with 80% sell imbalance
→ Selling exhaustion likely
→ Wait for bullish reversal candle
→ Enter long with stop below VAL
```
5. Multi-Session Analysis
When "Separate Profiles Per Session" is enabled:
Session-Specific Levels:
- Each session creates its own POC and value area
- Compare sessions to identify:
- Where institutions accumulated/distributed
- Which levels each session respected
- Unfinished business from previous sessions
Trading Strategies:
A. Session POC Confluence
London POC: $49,500
NY POC: $49,550
→ Strong support zone at $49,500-$49,550
→ High probability long setup on pullback
B. Value Area Overlap
London VAH: $50,000
NY VAL: $49,800
→ Overlap creates strong consolidation zone
→ Breakout strategy: Enter on break above $50,000
C. Unfinished Business
London session rejected $51,000 (sell imbalance)
NY session hasn't tested this level yet
→ Watch for NY session to revisit $51,000
→ Potential reversal zone
D. Session Handoff
Tokyo session: Sideways, low volume
London session: Strong buying delta, break above VAH
NY session: Continuation or reversal?
→ Monitor NY open for direction confirmation
6. Market Profile Analysis
Profile Shape Interpretation:
A. P-Shape (Peak at Top)
- High volume at top of range
- Interpretation : Distribution, potential reversal down
- Strategy : Look for shorts at resistance
B. b-Shape (Peak at Bottom)
- High volume at bottom of range
- Interpretation : Accumulation, potential reversal up
- Strategy : Look for longs at support
C. D-Shape (Peak in Middle)
- Balanced profile, POC in center
- Interpretation : Equilibrium, neutral market
- Strategy : Range trading between VAH/VAL
D. Thin Profile (LVN Gap)
- Low volume throughout
- Interpretation : Trending market, little acceptance
- Strategy : Trend following, avoid counter-trend trades
---
🎯 COMPLETE TRADING WORKFLOW
Step 1: Market Structure Analysis
1. Identify overall profile shape
2. Locate POC, VAH, VAL
3. Note HVN and LVN zones
4. Check current price position relative to value area
Step 2: Delta & Imbalance Check
1. Review delta distribution (where are buyers/sellers?)
2. Identify imbalance zones
3. Look for delta divergences
4. Note any exhaustion signals
Step 3: Session Analysis (if enabled)
1. Compare current session vs previous sessions
2. Identify key levels each session created
3. Look for level confluences or gaps
4. Note unfinished business
Step 4: Trade Setup
1. Define your bias (long/short/neutral)
2. Identify entry zone (HVN, VAH/VAL, POC)
3. Set stop loss (below/above key level or opposite LVN)
4. Set target (next HVN, VAH/VAL, or session high/low)
Step 5: Execution & Management
1. Wait for price to reach entry zone
2. Confirm with price action (candlestick patterns)
3. Enter trade with defined risk
4. Move stop to breakeven at first target
5. Trail stop or take profits at resistance/support
---
📋 EXAMPLE TRADE SCENARIOS
Scenario 1: Long Setup at VAL
Setup:
- Price pulled back to VAL ($49,200)
- VAL coincides with HVN (yellow zone)
- Delta showing +15% buying (green)
- London session POC also at $49,200
Entry:
- Buy at $49,200 (VAL/HVN confluence)
- Stop loss: $49,000 (below VAL, in LVN)
- Target 1: $49,800 (POC)
- Target 2: $50,200 (VAH)
Management:
- Move stop to breakeven when Target 1 reached
- Trail stop below recent swing lows
- Exit 50% at VAH, let remainder run
Risk:Reward : 200 points risk / 1000 points potential = 1:5 R:R
---
Scenario 2: Short Setup at Sell Imbalance
Setup:
- Price at VAH ($50,500)
- Sell imbalance zone (85% sellers, bright red)
- Bearish divergence (higher high, weaker delta)
- Previous session rejected this level
Entry:
- Short at $50,500 after bearish engulfing candle
- Stop loss: $50,750 (above VAH + imbalance zone)
- Target 1: $50,000 (POC)
- Target 2: $49,600 (VAL)
Management:
- Take 50% profit at POC
- Trail stop above recent swing highs
- Exit remainder at VAL or if delta turns positive
Risk:Reward : 250 points risk / 900 points potential = 1:3.6 R:R
---
Scenario 3: Range Trading Inside Value Area
Setup:
- Market consolidating between VAH ($50,200) and VAL ($49,600)
- POC at $49,900
- Multiple HVNs creating range boundaries
- Delta oscillating between +/-10%
Long Trade:
- Entry: $49,650 (near VAL)
- Stop: $49,500 (below VAL)
- Target: $50,150 (near VAH)
- Risk:Reward: 150/500 = 1:3.3
Short Trade:
- Entry: $50,150 (near VAH)
- Stop: $50,300 (above VAH)
- Target: $49,700 (near VAL)
- Risk:Reward: 150/450 = 1:3
Management:
- Reduce position size in range trading
- Take profits at opposite boundary
- Exit if breakout occurs (stop hunt possible)
---
Scenario 4: Session Breakout Trade
Setup:
- London session: Range-bound $49,500-$50,000
- London VAH at $50,000 (resistance)
- NY session opens: Strong buying delta (+35%)
- Price breaks above $50,000 with momentum
Entry:
- Buy on breakout above $50,000
- Or buy on retest of $50,000 (old resistance = new support)
- Stop loss: $49,700 (below breakout level + buffer)
- Target 1: $50,500 (next HVN from previous day)
- Target 2: $51,000 (measured move)
Management:
- Enter 50% position on breakout
- Add remaining 50% on successful retest
- Move stop to breakeven when price +$300
- Trail stop below 20 EMA or recent higher lows
Risk:Reward : 300 points risk / 1000 points potential = 1:3.3 R:R
---
⚠️ BEST PRACTICES & RISK MANAGEMENT
Do's:
✅ Use on liquid markets (major crypto, forex, indices)
✅ Combine with price action and candlestick patterns
✅ Wait for confirmation before entering trades
✅ Always use stop losses based on volume structure
✅ Take partial profits at key levels (HVN, VAH/VAL)
✅ Adjust lookback period based on timeframe
✅ Use higher timeframe profiles for context
✅ Compare current profile with previous day/session
✅ Consider volume trends (increasing/decreasing)
✅ Backtest strategies on your specific market
Don'ts:
❌ Don't trade solely based on this indicator
❌ Don't ignore price action and market context
❌ Don't place stops in LVN zones (prone to spikes)
❌ Don't chase price in low volume areas
❌ Don't overtrade - wait for quality setups
❌ Don't use on extremely low volume/illiquid assets
❌ Don't forget to adjust for different market conditions
❌ Don't ignore fundamental news events
❌ Don't use excessive leverage even with good setups
❌ Don't force trades - patience is key
Risk Management Rules:
1. Risk per trade : Never risk more than 1-2% of capital
2. Position sizing : Based on stop loss distance
3. Stop placement : Always below/above key volume levels
4. Profit taking : Scale out at multiple targets
5. Drawdown limits : Stop trading after 3 consecutive losses
6. Win rate expectation : 50-60% is realistic
7. Risk:Reward minimum : Aim for 1:2 or better
8. Correlation : Don't take correlated positions
---
🔧 TROUBLESHOOTING & OPTIMIZATION
If profiles look too compressed:
- Increase "Bins" to 40-50
- Reduce "LookBack" period
- Adjust "Horizontal Offset"
If too cluttered:
- Disable "Delta Labels"
- Disable "Volume Bars"
- Keep only POC and Value Area
- Use "Session Background Overlay" instead of separate profiles
For scalping (1-5 min):
- LookBack: 300-500 bars
- Bins: 20-30
- Enable separate session profiles
- Focus on imbalance zones
For swing trading (1H-4H):
- LookBack: 100-200 bars
- Bins: 25-35
- Focus on VAH/VAL and HVN
- Disable session features
For position trading (Daily):
- LookBack: 50-100 bars
- Bins: 30-40
- Focus on weekly/monthly POC
- Compare with previous week profiles
---
📚 ADVANCED CONCEPTS
1. Composite Profiles
- Build profiles across multiple days
- Increase LookBack to 500+ bars on 15-min chart
- Identifies major support/resistance from weeks of data
- Use for swing trading key levels
2. Profile Migration
- Track how POC moves day over day
- Uptrend : POC migrating higher
- Downtrend : POC migrating lower
- Range : POC oscillating in same area
3. Failed Auctions
- Price briefly leaves value area but quickly returns
- Failed auction high : Bearish signal
- Failed auction low : Bullish signal
- Indicates rejection of new price levels
4. Overnight Inventory
- Compare previous day's close to value area
- Close above VAH : Bullish bias for next day
- Close below VAL : Bearish bias for next day
- Close in value area : Neutral, range expected
5. Volume Delta Momentum
- Track cumulative delta across time
- Rising cumulative delta + rising price : Strong trend
- Falling cumulative delta + rising price : Weak/topping
- Rising cumulative delta + falling price : Potential reversal
---
📊 INTEGRATION WITH OTHER INDICATORS
Complementary Indicators:
1. Moving Averages (20/50/200 EMA)
- Use with POC and VAH/VAL
- Confluence with EMAs = stronger levels
2. RSI/Stochastic
- Overbought at resistance (VAH/HVN) = strong short
- Oversold at support (VAL/HVN) = strong long
3. VWAP
- POC often aligns with VWAP
- Deviation from VWAP + Volume Profile = trade setup
4. Order Flow/Footprint Charts
- Confirm delta analysis
- Detailed buyer/seller pressure
5. Market Profile (TPO)
- Similar concept, different visualization
- Use together for complete picture
Example Multi-Indicator Setup:
Price at VAL ✓
+ 200 EMA support ✓
+ RSI oversold (30) ✓
+ Positive delta zone ✓
+ Bullish engulfing candle ✓
= High probability long entry
---
🎓 LEARNING CURVE & PRACTICE
Week 1-2: Understanding
- Study each feature individually
- Identify POC, VAH, VAL on historical charts
- Note HVN and LVN patterns
- Observe how price reacts to these levels
Week 3-4: Pattern Recognition
- Track different profile shapes
- Identify session-specific patterns
- Note delta distribution patterns
- Document imbalance zone outcomes
Week 5-6: Paper Trading
- Take simulated trades based on setups
- Record entry/exit reasoning
- Track win rate and R:R
- Refine strategy based on results
Week 7-8: Live Trading (Small Size)
- Start with minimal position sizes
- Focus on execution and discipline
- Build confidence with real money
- Gradually increase size as proficiency grows
Ongoing:
- Review trades weekly
- Keep trading journal
- Adapt to changing market conditions
- Continuously refine strategy
---
💡 KEY TAKEAWAYS
1. Volume Profile shows WHERE the market is most active (POC, HVN)
2. Delta shows WHO is in control (buyers vs sellers)
3. Value Area shows FAIR VALUE (equilibrium zone)
4. Volume Nodes show STRUCTURE (support/resistance)
5. Imbalances show EXHAUSTION (potential reversals)
6. Sessions show PARTICIPATION (institutional activity)
The indicator is a MAP, not a SIGNAL:
- It shows you the battlefield terrain
- You still need to decide when/how to engage
- Combine with price action for best results
- Risk management is always paramount
---
⚖️ DISCLAIMER
This indicator is for educational and informational purposes only.
- Not financial advice
- Past performance does not guarantee future results
- Trading involves substantial risk of loss
- Only trade with capital you can afford to lose
- Always do your own research and due diligence
- Test strategies thoroughly before risking real money
- Consider consulting a licensed financial advisor
The creator is not responsible for any trading losses incurred while using this indicator.
---
Happy Trading! 📈🚀

Psychological levels [Kodologic] Psychological levels
Markets are not random, they are driven by human psychology and algorithmic order flow. A well-known phenomenon in trading is the "Whole Number Bias" — the tendency for price to react significantly at clean, round numbers (e.g., Bitcoin at $95,000 or EURUSD at 1.0500).
Manually drawing horizontal lines at every round number is tedious, clutters your object tree, and distracts you from analyzing price action.
Psychological levels Numbers is a workflow utility designed to solve this problem. It automatically projects a clean, customizable grid of key price levels onto your chart, helping you instantly identify areas where liquidity and orders are likely to cluster.
Why This Indicator Helps Traders :
Professional traders know that "00" and "50" levels act as magnets for price. Here is how this tool assists in your analysis:
1. Institutional Footprints : Large institutions and bank algorithms often execute orders at whole numbers to simplify accounting. This script highlights these potential liquidity zones automatically.
2. Support & Resistance Discovery: You will often notice price wicking or reversing exactly on these grid lines. This helps in spotting natural support and resistance without needing complex technical analysis.
3. Cognitive Load Reduction: Instead of calculating where the next "major level" is, the grid is visually present, allowing you to focus on candlestick patterns and market structure.
Features :
Dynamic Calculation : The grid updates automatically as price moves, you never have to redraw lines.
Zero Clutter : The lines are drawn using code, meaning they do not appear in your manual drawing tools list or clutter your object tree.
Fully Customizable Step : You define what constitutes a "Round Number" for your specific asset class (Forex, Crypto, Indices, or Stocks).
Visual Control : Adjust line styles (Solid, Dotted, Dashed), colors, and transparency to keep your chart aesthetic and readable.
How to Use in Your Strategy :
1. Target Setting (Take Profit)
If you are in a long position, use the next upper grid line as a logical Take Profit area. Price often gravitates toward these whole numbers before reversing or consolidating.
2. Stop Loss Placement
Avoid placing Stop Losses exactly on a round number, as these are often "stop hunted." Instead, use the grid to visualize the level and place your stop slightly *below* or *above* the round number for better protection.
3. Confluence Trading
Do not use these lines in isolation. Look for Confluence :
Example: If a Fibonacci 61.8% level lines up exactly with a Round Number grid line, that level becomes a high-probability reversal zone.
Settings Guide (Important)
Since every asset is priced differently, you must adjust the "levels Step Size" to match your instrument:
Forex (e.g., EURUSD, GBPUSD): Set Step Size to `0.0050` (50 pips) or `0.0100` (100 pips).
Crypto (e.g., BTCUSD): Set Step Size to `500` or `1000`.
Indices (e.g., US30, SPX500): Set Step Size to `100` or `500`.
Gold (XAUUSD):** Set Step Size to `10`.
Disclaimer: This tool is for educational and visual aid purposes only. It does not provide buy or sell signals. Always manage your risk.

MM Trap Reversal System [TradeHawk]MM TRAP REVERSAL SYSTEM by Timmy741
The only indicator that doesn't just show arrows — it gives you the full battle plan.
Detects real Market Maker stop hunts (liquidity sweeps) and tells you exactly:
WHAT TO DO → BUY / SELL / WAIT
WHEN TO ENTER → Exact trigger candle
WHERE TO ENTER → Current close (or better on pullback)
WHERE YOUR STOP GOES → ATR or wick-based
YOUR TARGETS → 1:2, 1:3, 1:4+ calculated automatically
CONFIDENCE → Filtered by volume, trend, chop, overextension
NO TRADE ZONES → When to stay the hell out (this saves accounts)
FEATURES
• Real swing high/low breach + rejection detection
• Strong wick requirement (default 50%+ of candle)
• Volume confirmation option
• Smart filters: kills trades in chop, low volume, overextended moves
• ADX + VWAP + deviation filters
• Full risk:reward calculation per trade
• Clean trade instruction panel (no clutter)
This is the system professional prop traders use to catch reversals after stop runs.
Works on all markets: Forex, Stocks, Futures, Crypto
Best on 15m – 4H timeframes
No repainting | No future leak | No magic
Just pure price action + liquidity concepts.
Released under MPL 2.0 — fully open source because real traders share the real stuff.
#mmtrap #stophunt #liquidity #reversal #smartmoney #ict #orderblock #fairvaluegap #fvg #propfirm #proptrading #reversalsystem

GRA v5 SNIPER# GRA v5 SNIPER - Documentation & Cheatsheet
## 🎯 Get Rich Aggressively v5 - SNIPER Edition
**Precision Futures Scalping | NQ • ES • YM • GC • BTC**
> **Philosophy:** *Quality over quantity. One sniper shot beats ten spray-and-pray attempts.*
---
## ⚡ QUICK CHEATSHEET
```
┌─────────────────────────────────────────────────────────────────────────────┐
│ GRA v5 SNIPER - QUICK REFERENCE │
├─────────────────────────────────────────────────────────────────────────────┤
│ │
│ 🎯 SIGNAL REQUIREMENTS (ALL MUST BE TRUE): │
│ ═══════════════════════════════════════════ │
│ ✓ Tier → B minimum (20+ pts NQ) │
│ ✓ Volume → 1.5x+ average │
│ ✓ Delta → 60%+ dominance (buyers OR sellers) │
│ ✓ Body → 70%+ of candle range │
│ ✓ Range → 1.3x+ average candle size │
│ ✓ Wicks → Small opposite wick (<50% of body) │
│ ✓ CVD → Trending with signal direction │
│ ✓ Session → London (3-5am ET) OR NY (9:30-11:30am ET) │
│ │
├─────────────────────────────────────────────────────────────────────────────┤
│ │
│ 📊 TIER ACTIONS: │
│ ════════════════ │
│ S-TIER (100+ pts) → 🥇 HOLD position, ride the wave │
│ A-TIER (50-99 pts) → 🥈 SWING for 2-3 minutes │
│ B-TIER (20-49 pts) → 🥉 SCALP quick, 30-60 seconds │
│ │
├─────────────────────────────────────────────────────────────────────────────┤
│ │
│ 🚨 ENTRY CHECKLIST: │
│ ═══════════════════ │
│ □ Signal appears (S🎯, A🎯, or B🎯) │
│ □ Table shows: Vol GREEN, Delta colored, Body GREEN │
│ □ CVD arrow matches direction (▲ for long, ▼ for short) │
│ □ Session active (LDN! or NY! in yellow) │
│ □ Enter at close of signal candle │
│ │
├─────────────────────────────────────────────────────────────────────────────┤
│ │
│ ⛔ DO NOT TRADE WHEN: │
│ ════════════════════ │
│ ✗ Session shows "---" (outside key hours) │
│ ✗ Vol shows RED (below 1.5x) │
│ ✗ Body shows RED (weak candle structure) │
│ ✗ Delta below 60% (no clear dominance) │
│ ✗ Multiple conflicting signals │
│ │
├─────────────────────────────────────────────────────────────────────────────┤
│ │
│ 📈 INSTRUMENT SETTINGS: │
│ ════════════════════════ │
│ NQ/ES (1-3 min): S=100, A=50, B=20 pts │
│ YM (1-5 min): S=100, A=50, B=25 pts │
│ GC (5-15 min): S=15, A=8, B=4 pts │
│ BTC (1-15 min): S=500, A=250, B=100 pts │
│ │
└─────────────────────────────────────────────────────────────────────────────┘
```
---
## 📋 DETAILED DOCUMENTATION
### What Makes SNIPER Different?
The SNIPER edition eliminates 80%+ of signals compared to standard GRA. Every signal that passes through has been validated by **8 independent filters**:
| Filter | Standard GRA | SNIPER GRA | Why It Matters |
|--------|-------------|------------|----------------|
| Volume | 1.3x avg | **1.5x avg** | Institutional participation |
| Delta | 55% | **60%** | Clear buyer/seller control |
| Body Ratio | None | **70%+** | No dojis or spinners |
| Range | None | **1.3x avg** | Significant price movement |
| Wicks | None | **<50% body** | Conviction in direction |
| CVD | None | **Required** | Trend confirmation |
| B-Tier Min | 10 pts | **20 pts** | Filter noise |
| Session | Optional | **Required** | Institutional hours |
---
### Signal Anatomy
When you see a signal like `A🎯`, here's what passed validation:
```
Signal: A🎯 LONG at 21,450.00
Validation Breakdown:
├── Points: 67.5 pts ✓ (A-Tier = 50-99)
├── Volume: 2.1x avg ✓ (≥1.5x required)
├── Delta: 68% Buyers ✓ (≥60% required)
├── Body: 78% of range ✓ (≥70% required)
├── Range: 1.6x avg ✓ (≥1.3x required)
├── Wick: Upper 15% ✓ (<50% of body)
├── CVD: ▲ Rising ✓ (Matches LONG)
└── Session: NY! ✓ (Active session)
RESULT: VALID SNIPER SIGNAL
```
---
### Table Legend
| Field | Reading | Color Meaning |
|-------|---------|---------------|
| **Pts** | Point movement | Gold/Green/Yellow = Tiered |
| **Tier** | S/A/B/X | Gold/Green/Yellow/White |
| **Vol** | Volume ratio | 🟢 ≥1.5x, 🔴 <1.5x |
| **Delta** | Buy/Sell % | 🟢 Buy dom, 🔴 Sell dom, ⚪ Neutral |
| **Body** | Body % of range | 🟢 ≥70%, 🔴 <70% |
| **CVD** | Cumulative delta | ▲ Bullish trend, ▼ Bearish trend |
| **Sess** | Session status | 🟡 Active, ⚫ Inactive |
---
### Trading Rules
#### Entry Rules
1. **Wait for signal** - Don't anticipate
2. **Verify table** - All conditions GREEN
3. **Enter at candle close** - Not during formation
4. **Position size by tier:**
- S-Tier: Full size
- A-Tier: 75% size
- B-Tier: 50% size
#### Exit Rules
| Tier | Target | Max Hold Time |
|------|--------|---------------|
| S | Let it run | 5-10 minutes |
| A | 1:1.5 R:R | 2-3 minutes |
| B | 1:1 R:R | 30-60 seconds |
#### Stop Loss
- Place at **opposite end of signal candle**
- For S-Tier: Allow 50% retracement
- For B-Tier: Tight stop, quick exit
---
### Session Priority
```
LONDON OPEN (3:00-5:00 AM ET)
════════════════════════════
• Best for: GC, European indices
• Characteristics: Stop hunts, reversals
• Look for: Sweeps of Asian session levels
NY OPEN (9:30-11:30 AM ET)
════════════════════════════
• Best for: NQ, ES, YM
• Characteristics: High volume, trends
• Look for: Continuation after 10 AM
```
---
### Common Mistakes to Avoid
| Mistake | Why It's Bad | Solution |
|---------|-------------|----------|
| Trading outside sessions | Low volume = fake moves | Wait for LDN! or NY! |
| Ignoring weak body | Dojis reverse | Body must be 70%+ |
| Fighting CVD | Swimming upstream | CVD must confirm |
| Oversizing B-Tier | Small moves = small size | 50% max on B |
| Chasing missed signals | FOMO loses money | Wait for next setup |
---
### Alert Setup
Configure these alerts in TradingView:
| Alert | Priority | Action |
|-------|----------|--------|
| 🎯 S-TIER LONG/SHORT | 🔴 High | Drop everything, check chart |
| 🎯 A-TIER LONG/SHORT | 🟠 Medium | Evaluate within 30 seconds |
| 🎯 B-TIER LONG/SHORT | 🟢 Low | Quick glance if available |
| LONDON/NY OPEN | 🔵 Info | Prepare for action |
---
### Pine Script v6 Notes
This indicator uses Pine Script v6 features:
- `request.security_lower_tf()` for intrabar delta
- Type inference for cleaner code
- Array operations for CVD calculation
**Minimum TradingView Plan:** Pro (for intrabar data)
---
## 🏆 Golden Rule
> **"If you have to convince yourself it's a good signal, it's not a good signal."**
The SNIPER edition is designed so that when a signal appears, there's nothing to think about. If all conditions are met, you trade. If any condition fails, you wait.
**Leave every trade with money. That's the goal.**
---
*© Alexandro Disla - Get Rich Aggressively v5 SNIPER*
*Pine Script v6 | TradingView*

Moving VWAP-KAMA CloudMoving VWAP-KAMA Cloud
Overview
The Moving VWAP-KAMA Cloud is a high-conviction trend filter designed to solve a major problem with standard indicators: Noise. By combining a smoothed Volume Weighted Average Price (MVWAP) with Kaufman’s Adaptive Moving Average (KAMA), this indicator creates a "Value Zone" that identifies the true structural trend while ignoring choppy price action.
Unlike brittle lines that break constantly, this cloud is "slow" by design—making it exceptionally powerful for spotting genuine trend reversals and filtering out fakeouts.
How It Works
This script uses a unique "Double Smoothing" architecture:
The Anchor (MVWAP): We take the standard VWAP and smooth it with a 30-period EMA. This represents the "Fair Value" baseline where volume has supported price over time.
The Filter (KAMA): We apply Kaufman's Adaptive Moving Average to the already smoothed MVWAP. KAMA is unique because it flattens out during low-volatility (choppy) periods and speeds up during high-momentum trends.
The Cloud:
Green/Teal Cloud: Bullish Structure (MVWAP > KAMA)
Purple Cloud: Bearish Structure (MVWAP < KAMA)
🔥 The "Reversal Slingshot" Strategy
Backtests reveal a powerful behavior during major trend changes, particularly after long bear markets:
The Resistance Phase: During a long-term downtrend, price will repeatedly rally into the Purple Cloud and get rejected. The flattened KAMA line acts as a "concrete ceiling," keeping the bearish trend intact.
The Breakout & Flip: When price finally breaks above the cloud with conviction, and the cloud flips Green, it signals a structural regime change.
The "Slingshot" Retest: Often, immediately after this flip, price will drop back into the top of the cloud. This is the "Slingshot" moment. The old resistance becomes new, hardened support.
The Rally: From this support bounce, stocks often launch into a sustained, multi-month bull run. This setup has been observed repeatedly at the bottom of major corrections.
How to Use This Indicator
1. Dynamic Support & Resistance
The KAMA Wall: When price retraces into the cloud, the KAMA line often flattens out, acting as a hard "floor" or "wall." A break of this wall usually signals a genuine trend change, not just a stop hunt.
2. Trend Confirmation (Regime Filter)
Bullish Regime: If price is holding above the cloud, only look for Long setups.
Bearish Regime: If price is holding below the cloud, only look for Short setups.
No-Trade Zone: If price is stuck inside the cloud, the market is traversing fair value. Stand aside until a clear winner emerges.
3. Multi-Timeframe Versatility
While designed for trend confirmation on higher timeframes (4H, Daily), this indicator adapts beautifully to lower timeframes (5m, 15m) for intraday scalping.
On Lower Timeframes: The cloud reacts much faster, acting as a dynamic "VWAP Band" that helps intraday traders stay on the right side of momentum during the session.
Settings
Moving VWAP Period (30): The lookback period for the base VWAP smoothing.
KAMA Settings (10, 10, 30): Controls the sensitivity of the adaptive filter.
Cloud Transparency: Adjust to keep your chart clean.
Alerts Included
Price Cross Over/Under MVWAP
Price Cross Over/Under KAMA
Cloud Flip (Bullish/Bearish Trend Change)
Tip for Traders
This is not a signal entry indicator. It is a Trend Conviction tool. Use it to filter your entries from faster indicators (like RSI or MACD). If your fast indicator signals "Buy" but the cloud is Purple, the probability is low. Wait for the Cloud Flip

Advanced Triple Strategy ScalperHere are the three scalping strategies presented in the video "3 Scalping Strategies That Work Every Day (Backtested & Proven)" by Asia Forex Mentor – Ezekiel Chew:
### Scalper’s Trend Filter (Triple EMA)
This strategy uses three EMAs (25, 50, 100) on the 5-minute chart to filter high-probability trades aligned with momentum .
- Only trade when all three EMAs are angled in the same direction and clearly separated (no crossing or tangling) .
- Enter when price pulls back toward the 25 or 50 EMA and then bounces back toward the 25 EMA, but do not enter if price closes below the 100 EMA .
- Set stop-loss just below the 50 EMA or swing low and aim for a risk-to-reward ratio of 1:1.5 .
### Flip Zone Trap (Reversal Catching)
This method identifies precise reversal moments where market structure shifts from weakness to strength .
- Use the 15-min chart to locate key support or resistance zones where price previously reacted .
- Wait for price to stop making lower lows and begin making higher highs (or vice versa for shorts); confirm with a trendline break AND follow-through (higher lows & highs within 5-7 candles) .
- Use confirmation candles (bullish engulfing, pin bar rejection) at the zone before entry .
### Liquidity Shift Trigger (Smart Money Trap)
This system leverages institutional stop hunts and liquidity sweeps at key zones for sniper entries .
- Start with a 15-min chart to identify structure breaks and points of interest (order blocks, flip zones, demand zones) .
- Drop to 1-min chart and wait for price to enter the refined zone and sweep liquidity (sharp wick/spike below/above key level) .
- Once liquidity is swept, wait for a clean structure shift (break of most recent internal high or low) within 5–6 candles—if confirmed, refine entry to the candle that caused the break and enter when price returns to that candle with a strong reaction .
***
### Practical Application
- These strategies are systematic, rule-based, and designed to cut out fake moves, avoid early stop-outs, and align entries with momentum and institutional activity .
- Perfect for short timeframes and volatile pairs like XAUUSD, especially if paired with additional confirmation from other technical analysis tools .
All three strategies emphasize filtering noise, waiting for momentum/trend confirmation, and avoiding impulsive entries—key principles for consistent scalping success

Retail vs Banker Net Positions – Symmetry BreakRetail vs Banker Net Positions – Symmetry Break (Institution Focus)
Description:
This advanced indicator is a volume-proxy-based positioning tool that separates institutional vs. retail behavior using bar structure, trend-following logic, and statistical analysis. It identifies net position flows over time, detects institutional aggression spikes, and highlights symmetry breaks—those moments when institutional action diverges sharply from retail behavior. Designed for intraday to swing traders, this is a powerful tool for gauging smart money activity and retail exhaustion.
What It Does:
Separates Volume into Two Groups:
Institutional Proxy: Volume on large bars in trend direction
Retail Proxy: Volume on small or counter-trend bars
Calculates Net Positions (%):
Smooths cumulative buying vs. selling behavior for each group over time.
Highlights Symmetry Breaks:
Alerts when institutions make statistically abnormal moves while retail is quiet or doing the opposite.
Detects Extremes in Institutional Activity:
Flags major tops/bottoms in institutional positioning using swing pivots or rolling windows.
Retail Sentiment Flips:
Marks when the retail line crosses the zero line (e.g., flipping from net short to net long).
How to Use It:
Interpreting the Two Lines:
Aqua/Orange Line (Institutional Proxy):
Rising above zero = Net buying bias
Falling below zero = Net selling bias
Lime/Red Line (Retail Proxy):
Green = Retail buying; Red = Retail selling
Watch for crosses of zero for sentiment shifts
Spotting Symmetry Breaks:
Pink Circle or Background Highlight =
Institutions made a sharp, outsized move while retail was:
Quiet (low ROC), or
Moving in the opposite direction
These often precede explosive directional moves or stop hunts.
Institutional Extremes:
Marked with aqua (top) or orange (bottom) dots
Based on swing pivot logic or rolling highs/lows in institutional positioning
Optional filter: Only show extremes that coincide with a symmetry break
Settings You Can Tune:
Lookback lengths for trend, z-scores, smoothing
Z-Score thresholds to control sensitivity
Retail quiet filters to reduce false positives
Cool-down timer to avoid rapid repeat signals
Toggle visual aids like shading, markers, and threshold lines
Alerts Included:
-Retail flips (green/red)
- Institutional symmetry breaks
- Institutional extreme tops/bottoms
Strategy Tip:
Use this indicator to track institutional accumulation or distribution phases and catch asymmetric inflection points where the "smart money" acts decisively. Confluence with price structure or FVGs (Fair Value Gaps) can further enhance signal quality.

Liquidity Grab + RSI Divergence═══════════════════════════════════════════════════════════════
LIQUIDITY GRAB + RSI DIVERGENCE INDICATOR
═══════════════════════════════════════════════════════════════
📌 OVERVIEW
This indicator identifies high-probability reversals by combining:
• Liquidity sweeps (stop hunts)
• RSI divergence confirmation
• Filters false breakouts automatically
═══════════════════════════════════════════════════════════════
🟢 BUY SIGNAL (Green Triangle Up)
REQUIRES BOTH CONDITIONS:
1. Liquidity Grab Below Previous Low
• Price breaks BELOW recent low
• Candle CLOSES ABOVE that low
• Traps sellers who shorted the breakdown
2. Bullish RSI Divergence
• Price: Lower Low (LL)
• RSI: Higher Low (HL)
• Shows weakening downward momentum
➜ Result: Potential bullish reversal
═══════════════════════════════════════════════════════════════
🔴 SELL SIGNAL (Red Triangle Down)
REQUIRES BOTH CONDITIONS:
1. Liquidity Grab Above Previous High
• Price breaks ABOVE recent high
• Candle CLOSES BELOW that high
• Traps buyers who bought the breakout
2. Bearish RSI Divergence
• Price: Higher High (HH)
• RSI: Lower High (LH)
• Shows weakening upward momentum
➜ Result: Potential bearish reversal
═══════════════════════════════════════════════════════════════
📊 VISUAL INDICATORS
Main Signals:
🔺 Large Green Triangle = BUY (Liq Grab + Bullish Div)
🔻 Large Red Triangle = SELL (Liq Grab + Bearish Div)
Reference Levels:
━ Red Line = Previous High Level
━ Green Line = Previous Low Level
Additional Markers (Optional):
○ Small Green Circle = Liquidity grab low only
○ Small Red Circle = Liquidity grab high only
✕ Small Blue Cross = Bullish divergence only
✕ Small Orange Cross = Bearish divergence only
═══════════════════════════════════════════════════════════════
⚙️ SETTINGS
1. Lookback Period (Default: 20)
• Range: 5-100
• Sets how far back to identify previous highs/lows
• Higher = fewer but stronger levels
• Lower = more frequent but weaker levels
2. RSI Length (Default: 14)
• Range: 5-50
• Standard RSI calculation period
• 14 is industry standard
3. RSI Divergence Lookback (Default: 5)
• Range: 3-20
• Controls pivot point sensitivity
• Higher = fewer divergence signals
• Lower = more divergence signals
4. Show Labels (Default: ON)
• Toggle BUY/SELL text labels
• Disable for cleaner chart view
═══════════════════════════════════════════════════════════════
💡 HOW TO USE
Step 1: WAIT FOR CONFIRMATION
• Only trade LARGE TRIANGLE signals
• Ignore small circles/crosses alone
Step 2: CHECK TIMEFRAME
• Best on: 15min, 1H, 4H, Daily
• Avoid: 1min, 5min (too noisy)
Step 3: CONFIRM CONTEXT
• Check overall market trend
• Identify key support/resistance
• Look for confluence with price action
Step 4: ENTRY & RISK MANAGEMENT
• Enter on signal candle close or pullback
• Stop loss below/above the liquidity grab wick
• Target: Previous swing high/low or key levels
• Risk/Reward: Minimum 1:2 ratio
Step 5: SET ALERTS
• Create alert for "BUY Signal"
• Create alert for "SELL Signal"
• Never miss opportunities
═══════════════════════════════════════════════════════════════
✅ BEST PRACTICES
DO:
✓ Use on multiple timeframes for confluence
✓ Combine with support/resistance zones
✓ Wait for both conditions (liq grab + divergence)
✓ Practice on demo account first
✓ Use proper position sizing
DON'T:
✗ Trade every small circle/cross
✗ Use on very low timeframes (<15min)
✗ Ignore overall market context
✗ Trade without stop loss
✗ Risk more than 1-2% per trade
═══════════════════════════════════════════════════════════════
⚠️ IMPORTANT NOTES
• This is a CONFIRMATION tool, not a holy grail
• No indicator is 100% accurate
• Combine with your trading strategy
• Backtest on your preferred instruments
• Adjust parameters for your trading style
• Higher timeframes = more reliable signals
• Always use risk management
═══════════════════════════════════════════════════════════════
🔔 ALERTS INCLUDED
Two alert conditions are built-in:
1. "BUY Signal" - Liquidity Grab + Bullish RSI Divergence
2. "SELL Signal" - Liquidity Grab + Bearish RSI Divergence
═══════════════════════════════════════════════════════════════
📈 RECOMMENDED SETTINGS BY TIMEFRAME
5-15 Min Charts:
• Lookback: 10-15
• RSI Length: 14
• RSI Div Lookback: 3-5
1H-4H Charts:
• Lookback: 20-30
• RSI Length: 14
• RSI Div Lookback: 5-7
Daily Charts:
• Lookback: 30-50
• RSI Length: 14
• RSI Div Lookback: 7-10
═══════════════════════════════════════════════════════════════
Good luck and trade safe! 🚀

Previous Candle High/Low (Global Rays)Previous Candle High/Low (Global Rays, Corrected)
This indicator tracks the high and low of the most recently closed candle and projects them forward as global horizontal rays.
Features:
✅ Automatically updates the levels once a candle fully closes.
✅ Draws persistent lines at the previous candle’s high (green) and low (red), extending them into the future.
✅ Highlights real-time breakouts:
✅ Includes built-in alert conditions for both breakout events.
How to Use:
Use the levels as reference points for breakout trades, liquidity sweeps, or stop hunts.
Alerts can help you catch moves without needing to constantly watch the chart.
Works on any timeframe and symbol.
ChopScore📝 Script Description: ChopScore – Candle-Based Choppiness Indicator
The ChopScore indicator helps traders assess the cleanliness and quality of recent price action by analyzing the relationship between candle body size and overall candle range (high-low).
Unlike traditional volatility or trend indicators, ChopScore does not assume trend direction. Instead, it focuses on how "clean" or "choppy" the price movement is, helping traders spot scrips and environments prone to shakeouts, fakeouts, or stop hunts.
📊 How It Works:
Calculates a custom choppiness score based on the ratio of the candle body to its full range (wicks included).
A smoothed average is plotted over a user-defined lookback period
.
The current score is displayed in a table on the chart, with colors indicating the choppiness level:
🔵 < 50: Cleaner price action (lower shakeout risk)
🟢 50–54.99: Moderate
🟠 55–59.99: Messier price action
🔴 ≥ 60: Very choppy (high shakeout potential)
⚙️ Inputs:
Lookback Period – Controls how many bars are used for averaging the choppiness.
Table Position – Choose where the score appears on the chart.
🎯 Use Case:
Use ChopScore to:
Identify scrips where price action is clean and decisive (e.g., safer entries).
Avoid scrips noise and shakeout potential.
Complement trend/momentum indicators without confusing direction with structure.
📌 Notes:
This script is for educational purposes and does not provide buy/sell signals.
Always confirm with additional tools or analysis before trading decisions.

Volatility Wick Trap — Smart Reversal EngineThe Volatility Wick Trap — Smart Reversal Engine is a precision reversal detection tool designed for traders who rely on smart money footprints, volatility compression, and liquidity wick exhaustion to time entries near market turns.
💡 Core Components:
Volatility Squeeze Detection: Identifies candles where range compresses significantly compared to the 14-period average true range, highlighting potential breakout zones.
Liquidity Wick Exhaustion: Detects candles with dominant upper or lower wicks, signaling failed liquidity grabs or stop hunts.
Contextual EMA Filter: Uses a 21-period EMA to filter signals, improving accuracy by aligning with market structure bias.
🔍 How It Works:
Green diamond lines mark bullish hidden reversal zones.
Red diamond lines mark bearish hidden reversal traps.
These lines only appear when volatility compresses and wick traps are confirmed within the trend context.
✅ Clean. Minimal. Tactical.
Ideal for scalpers, swing traders, and smart money enthusiasts looking to fade emotional price spikes.

MP MTF LiquidityMP MTF Liquidity
Multi-Timeframe Liquidity Levels – Automatic High/Low Tracking
This indicator automatically tracks and draws liquidity levels (recent highs and lows) from up to 6 custom timeframes directly on your chart. It’s designed for advanced traders who want to visualize important swing points and liquidity pools across multiple timeframes—ideal for Smart Money Concepts (SMC), ICT, and price action trading.
Key Features:
Multi-Timeframe Support:
Select up to 6 different timeframes (ex: 1H, 4H, Daily, Weekly, etc.), each with separate color and visibility controls.
Real Liquidity (No Repaint):
Levels are only drawn from fully closed bars on each timeframe—no lines from currently forming candles, ensuring accuracy and no forward-looking bias.
Automatic Detection:
Highs and lows are detected automatically. Levels that get swept (price breaks through) are converted to dashed lines for easy visual distinction.
Customizable:
Choose line colors for highs/lows and set the maximum number of active levels per timeframe to keep charts clean.
Extended Lines:
All levels are extended to the right, helping you see how current price interacts with past liquidity.
How It Works:
On every new bar of your chosen higher timeframe(s), the indicator records the high and low of the previous (just-closed) candle.
These levels are extended as rays until price sweeps (crosses) them.
When a level is swept, it is redrawn as a dashed line to highlight liquidity grabs or stop hunts.
No lines are drawn for the “live” bar—only confirmed, closed levels are displayed.
Who is this for?
SMC, ICT, and price action traders seeking high-confidence liquidity zones.
Intraday, swing, and multi-timeframe traders who want an automated, visual edge.
Anyone wanting to avoid repainting or “fake” levels from unfinished candles.
Tip:
Combine this indicator with your favorite order block, fair value gap (FVG), or market structure tools for even greater context and confluence.
Disclaimer:
No indicator guarantees profits. Always use with proper risk management and in conjunction with your trading plan.

Institutional Sweep Zone (Range-Based)Institutional Sweep Zone (Range-Based)
This indicator models potential stop sweep zones based on institutional capital ranges, helping traders visualize where high-probability liquidity grabs are likely to occur.
Unlike traditional volatility bands, this tool estimates price movement by calculating how far a specific amount of capital—entered into the market—can push price. By defining a lower and upper capital range (in millions of USD), the indicator dynamically draws bands representing the distance institutions could realistically move price in either direction.
It supports directional control, allowing you to focus on long sweeps, short sweeps, or both simultaneously. The pip cost is auto-calibrated based on the selected currency pair, making it highly adaptive to major FX pairs.
Key Features:
-Capital input range (in millions of USD)
-Directional sweep targeting: Long, Short, or Both
-Auto-detection of pip value based on FX pair
-Visual sweep zone mapped above and below current price
-Designed to highlight areas of institutional stop hunts
Why use it?
-Helps avoid setting stops inside common sweep zones
-Improves trade survivability when paired with higher timeframe strategies
-Offers a unique way to view price through an institutional lens
Created by: The_Forex_Steward
Explore more advanced tools and concepts on my TradingView profile.

BSL & SSL - Liquidity Zones
BSL & SSL - Liquidity Zones
Indicator Description (for TradingView)
Concept
The BSL & SSL - Liquidity Zones indicator is a simple yet powerful visual tool that helps traders identify key liquidity zones in the market by tracking prominent highs and lows on the chart.
It is based on the concept that the Highest High (Buy Side Liquidity - BSL) and Lowest Low (Sell Side Liquidity - SSL) represent zones where stop-loss orders and pending orders accumulate — often attracting future price movements.
Purpose
This indicator helps traders spot hidden liquidity levels which may act as targets or potential reversal points. It is especially useful for traders who apply Smart Money Concepts (SMC) or institutional trading models.
Great for detecting potential stop hunts and understanding market structure shifts.
How It Works
The indicator calculates the Highest High and Lowest Low over a user-defined period (default: 20 candles).
When a new Higher High forms, it marks a new BSL.
When a new Lower Low forms, it marks a new SSL.
These zones are likely to attract price in the future — either as targets or traps.
Visualization
The indicator draws static horizontal lines (Stepline style) at BSL and SSL levels.
These lines remain in place until broken or a new level is formed.
Visual Labels enhance clarity:
🟢 Green Label → BSL
🔴 Red Label → SSL
Trading Insights / Practical Use
When price approaches a BSL or SSL zone, ask yourself:
✅ Will price break the level to grab liquidity?
✅ Will there be a reversal after liquidity is taken?
The indicator does not provide signals by itself — it serves as a valuable confirmation tool when combined with:
Price Action
Support & Resistance
Momentum Indicators
SMC Tools
Key Benefits
✅ Easy to use
✅ Enhances liquidity analysis
✅ Highlights zones targeted by institutional players
✅ Simple calculation — no complex formulas
Limitations
🚫 Does NOT generate buy/sell signals
🚫 Should be used as part of a complete trading framework
Conclusion
BSL & SSL - Liquidity Zones is a versatile and intuitive tool for any trader looking to better understand where liquidity is positioned on the chart.
It works across all timeframes and complements any trading strategy, especially Smart Money-based approaches.

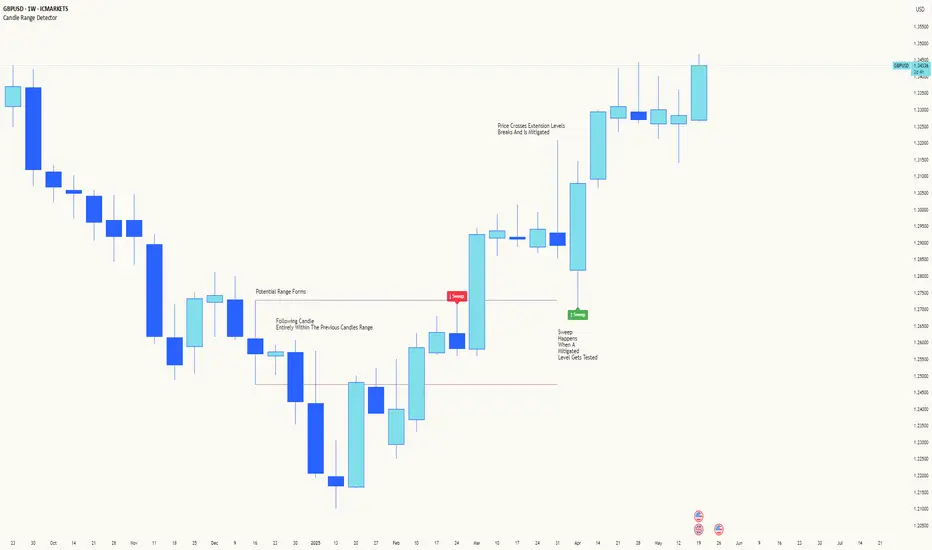
Candle Range DetectorCandle Range Detector
// Pine Script v6
// Detects candle-based ranges, mitigations, and sweeps with advanced logic
Overview
This indicator automatically detects price ranges based on candle containment, then tracks when those ranges are mitigated (broken) and when a sweep occurs. It is designed for traders who want to identify liquidity events and range breaks with precision.
How It Works
- Range Detection: A range is formed when a candle is fully contained within the previous candle (its high is lower and its low is higher). This marks a potential area of price balance or liquidity.
- Mitigation: A range is considered mitigated when price closes beyond its extension levels (configurable by normal or Fibonacci logic). This signals that the range has been invalidated or "taken out" by price action.
- Sweep Detection: After mitigation, the script watches for a sweep event: a candle that both trades through the range extreme and closes decisively beyond the log-mid of the candle itself. This is a strong sign of a liquidity grab or stop run.
- Alerts & Visuals: You can enable alerts and on-chart labels for sweeps. Only the most recent mitigated range can be swept, and each range can only be swept once.
- Timeframe Sensitivity: On weekly or monthly charts, a candle can both mitigate and sweep a range on the same bar. On lower timeframes, only one event can occur per bar.
Why It Works
- Candle containment is a robust way to identify natural price ranges and liquidity pools, as it reflects where price is consolidating or being absorbed.
- Mitigation marks the moment when a range is no longer defended, often leading to new directional moves.
- Sweeps are powerful signals of stop hunts or liquidity grabs, especially when confirmed by a close beyond the log-mid of the candle, indicating strong intent.
Visual Explanation
Tip: Use this tool to spot high-probability reversal or continuation zones, and to get alerted to key liquidity events in real time.
Liqudation HeatMap [BigBeluga]🔵 OVERVIEW
An advanced liquidity visualization tool that plots horizontal heat zones to highlight where potential liquidations and volume clusters are most likely hiding beneath price action.
Liqudation HeatMap scans historical price movements for local highs and lows with elevated volume or candle range. It then draws dynamic heatmap boxes—shaded from lime (low interest) to yellow (high interest)—revealing potential zones of trapped positions or stop clusters. A vertical scale on the right shows you the relative strength of volume behind each level, from 0 to the highest detected.
🔵 CONCEPTS
Maps areas of potential liquidity using volume or candle range (if volume is unavailable).
Identifies swing highs/lows (pivots) and extends heatmap boxes outward from these levels. Colors each zone based on the relative strength of volume concentration.
Fades or removes zones once price crosses their midpoints, simulating the idea of liquidity being “consumed.”
Displays a live vertical scale that shows the volume range for quick reference.
🔵 FEATURES
Dynamic Heatmap Zones:
Draws few boxes above and after pivot highs and below pivot lows, each shaded based on volume concentration.
Smart Coloring System:
Uses a gradient from lime (low) to yellow (high) to visually distinguish between weak and strong liquidity zones.
Adaptive ATR Widths:
Automatically adjusts zone thickness based on volatility (ATR), scaling intelligently across timeframes.
Liquidity Consumption Logic:
Zones are stope extending once price interacts with them—mimicking the behavior of real liquidation sweeps.
Volume Scale Legend:
A real-time scale is plotted on the right side, showing the min-max range of volume used for heat calculations.
🔵 HOW TO USE
Look for thick yellow zones to identify areas of concentrated stop losses or liquidation triggers.
Use these levels to anticipate mean reversion points or high-volatility zones.
Combine with your trend or structure tools to trade into or fade these liquidity pools.
On lower timeframes, use this tool to confirm entries around sweeps or deviations.
Use the right-side scale to compare relative zone strength instantly.
🔵 CONCLUSION
Liqudation HeatMap is a powerful visualization tool that uncovers where liquidity likely resides on the chart. By highlighting hidden traps and reactive levels in real-time, it gives traders a significant edge when it comes to spotting stop hunts, mean reversions, and areas of institutional interest. Whether you’re scalping or swing trading, this heatmap provides unmatched context on the market’s hidden intent.

Whale Psychology Insights
### 🧠 Whale Psychology Insights – Unmasking Smart Money Moves
**Understand the mind games behind every candle.**
This advanced indicator is designed to reveal the psychological warfare played by whales and market manipulators in the crypto space. Stop trading blind—start trading with the insights of the smart money.
#### 🔍 What It Does:
- **Liquidity Zone Detection** – Automatically identifies key **swing highs/lows** where stop hunts are likely.
- **Volume Spike Alerts** – Spot **suspicious activity** where big players enter or exit.
- **Order Block Zones** – Highlights **bullish/bearish engulfing patterns** used by institutions.
- **Fair Value Gaps (FVG)** – Marks price inefficiencies where price may return.
- **Fakeout Detection** – Finds **manipulative wicks** designed to trap retail traders.
#### 💡 Use Cases:
- Avoid getting stopped out by **liquidity grabs**
- Enter after the **whales have made their move**
- Identify **high-probability reversal zones**
- Trade **with smart money**, not against it
Perfect for scalpers, intraday traders, and swing traders looking to understand *why* price moves—not just *where*.
> 🧠 **Trade the psychology, not just the chart.**

ICT Liquidity Sweep MAX RETRI (ALERT)Strategy Description: SMC + ICT Reversal Sniper | 5-Min | R2 TP
This strategy applies Smart Money Concepts (SMC) and ICT methodology to identify high-probability reversal trades using a clean, rule-based system designed for the 5-minute timeframe.
⸻
Core Logic:
• Liquidity Sweep: Identifies stop hunts beyond recent swing highs/lows using a configurable lookback window.
• Break of Structure (BOS): Validates a directional shift after the sweep.
• Fixed R2 Risk-Reward: Entry is followed by a 2:1 take-profit target. Stop loss is set at the sweep candle’s high/low.
• No Entry Between 8 PM–12 AM NY Time: Avoids the manipulation-prone and illiquid zone.
• Discreet SL Handling: SL hits close trades silently — no labels or visuals.
⸻
Entry Precision & Timing Notes:
• The strategy may occasionally fire before a confirmed liquidity sweep — this is expected. If a sweep occurs later, you may still re-enter toward equilibrium, with take profit also targeted at equilibrium.
• Alerts or trades that trigger near 9:30 AM NY often align with real direction, but this time can be volatile.
• For more reliable and lower-risk entries, focus on the 1:30 PM to 2:00 PM silver bullet window, which tends to produce cleaner setups with more favorable flow. 🖤

Liquidity Sweep Filter Strategy [AlgoAlpha X PineIndicators]This strategy is based on the Liquidity Sweep Filter developed by AlgoAlpha. Full credit for the concept and original indicator goes to AlgoAlpha.
The Liquidity Sweep Filter Strategy is a non-repainting trading system designed to identify liquidity sweeps, trend shifts, and high-impact price levels. It incorporates volume-based liquidation analysis, trend confirmation, and dynamic support/resistance detection to optimize trade entries and exits.
This strategy helps traders:
Detect liquidity sweeps where major market participants trigger stop losses and liquidations.
Identify trend shifts using a volatility-based moving average system.
Analyze volume distribution with a built-in volume profile visualization.
Filter noise by differentiating between major and minor liquidity sweeps.
How the Liquidity Sweep Filter Strategy Works
1. Trend Detection Using Volatility-Based Filtering
The strategy applies a volatility-adjusted moving average system to determine trend direction:
A central trend line is calculated using an EMA smoothed over a user-defined length.
Upper and lower deviation bands are created based on the average price deviation over multiple periods.
If price closes above the upper band, the strategy signals an uptrend.
If price closes below the lower band, the strategy signals a downtrend.
This approach ensures that trend shifts are confirmed only when price significantly moves beyond normal market fluctuations.
2. Liquidity Sweep Detection
Liquidity sweeps occur when price temporarily breaks key levels, triggering stop-loss liquidations or margin call events. The strategy tracks swing highs and lows, marking potential liquidity grabs:
Bearish Liquidity Sweeps – Price breaks a recent high, then reverses downward.
Bullish Liquidity Sweeps – Price breaks a recent low, then reverses upward.
Volume Integration – The strategy analyzes trading volume at each sweep to differentiate between major and minor sweeps.
Key levels where liquidity sweeps occur are plotted as color-coded horizontal lines:
Red lines indicate bearish liquidity sweeps.
Green lines indicate bullish liquidity sweeps.
Labels are displayed at each sweep, showing the volume of liquidated positions at that level.
3. Volume Profile Analysis
The strategy includes an optional volume profile visualization, displaying how trading volume is distributed across different price levels.
Features of the volume profile:
Point of Control (POC) – The price level with the highest traded volume is marked as a key area of interest.
Bounding Box – The profile is enclosed within a transparent box, helping traders visualize the price range of high trading activity.
Customizable Resolution & Scale – Traders can adjust the granularity of the profile to match their preferred time frame.
The volume profile helps identify zones of strong support and resistance, making it easier to anticipate price reactions at key levels.
Trade Entry & Exit Conditions
The strategy allows traders to configure trade direction:
Long Only – Only takes long trades.
Short Only – Only takes short trades.
Long & Short – Trades in both directions.
Entry Conditions
Long Entry:
A bullish trend shift is confirmed.
A bullish liquidity sweep occurs (price sweeps below a key level and reverses).
The trade direction setting allows long trades.
Short Entry:
A bearish trend shift is confirmed.
A bearish liquidity sweep occurs (price sweeps above a key level and reverses).
The trade direction setting allows short trades.
Exit Conditions
Closing a Long Position:
A bearish trend shift occurs.
The position is liquidated at a predefined liquidity sweep level.
Closing a Short Position:
A bullish trend shift occurs.
The position is liquidated at a predefined liquidity sweep level.
Customization Options
The strategy offers multiple adjustable settings:
Trade Mode: Choose between Long Only, Short Only, or Long & Short.
Trend Calculation Length & Multiplier: Adjust how trend signals are calculated.
Liquidity Sweep Sensitivity: Customize how aggressively the strategy identifies sweeps.
Volume Profile Display: Enable or disable the volume profile visualization.
Bounding Box & Scaling: Control the size and position of the volume profile.
Color Customization: Adjust colors for bullish and bearish signals.
Considerations & Limitations
Liquidity sweeps do not always result in reversals. Some price sweeps may continue in the same direction.
Works best in volatile markets. In low-volatility environments, liquidity sweeps may be less reliable.
Trend confirmation adds a slight delay. The strategy ensures valid signals, but this may result in slightly later entries.
Large volume imbalances may distort the volume profile. Adjusting the scale settings can help improve visualization.
Conclusion
The Liquidity Sweep Filter Strategy is a volume-integrated trading system that combines liquidity sweeps, trend analysis, and volume profile data to optimize trade execution.
By identifying key price levels where liquidations occur, this strategy provides valuable insight into market behavior, helping traders make better-informed trading decisions.
Key use cases for this strategy:
Liquidity-Based Trading – Capturing moves triggered by stop hunts and liquidations.
Volume Analysis – Using volume profile data to confirm high-activity price zones.
Trend Following – Entering trades based on confirmed trend shifts.
Support & Resistance Trading – Using liquidity sweep levels as dynamic price zones.
This strategy is fully customizable, allowing traders to adapt it to different market conditions, timeframes, and risk preferences.
Full credit for the original concept and indicator goes to AlgoAlpha.

TJR SEEK AND DESTROYTJR SEEK AND DESTROY – Intraday ICT Trading Tool
Built for day traders, TJR SEEK AND DESTROY combines Smart Money concepts like order blocks, fair value gaps, and liquidity sweeps with structure breaks and daily bias to pinpoint high-probability trades during US market hours (9:30–16:00). Ideal for scalping or intraday strategies on stocks, futures, or forex.
What Makes It Unique?
Unlike standalone ICT indicators, this script integrates:
Order Blocks with volume and range filters for precise support/resistance zones.
Fair Value Gaps (FVG) to spot pre-market price imbalances.
Break of Structure (BOS) and Liquidity Sweeps for trend and reversal signals.
A 1H MA-based Bias to align trades with the day’s direction.
BUY/SELL Labels triggered only when bias, BOS, and sweeps align, reducing noise.
How Does It Work?
Order Blocks: Marks zones with high volume (>1.5x 20-period SMA) and low range (<0.5x ATR20) as teal boxes—potential reversal points.
Fair Value Gap: Compares the prior day’s close to the current open (pre- or post-9:30), shown as a purple line and label (e.g., "FVG: 0.005").
Pivot Point: Calculates (prevHigh + prevLow + prevClose) / 3 from the prior day, plotted as an orange line for equilibrium.
Break of Structure: Detects crossovers of 5-bar highs/lows (gray lines), marked with red triangles.
Liquidity Sweeps: Tracks breaches of the prior day’s high/low (yellow lines), marked with yellow triangles.
Daily Bias: Uses 1H close vs. 20-period MA (blue line) for bullish (green background), bearish (red), or neutral (gray) context.
Signals: BUY (green label) when bias is bullish, price breaks up, and sweeps the prior high; SELL (red label) when bias is bearish, price breaks down, and sweeps the prior low.
How to Use It
Setup: Apply to 1M–15M charts for US session trading (9:30–16:00 EST).
Trading:
Wait for a BUY label after a yellow sweep triangle above the prior day’s high in a green (bullish) background.
Wait for a SELL label after a yellow sweep triangle below the prior day’s low in a red (bearish) background.
Use order blocks (teal boxes) as support/resistance for stop-loss or take-profit.
Markets: Best for SPY, ES futures, or forex pairs with US session volatility.
Underlying Concepts
Order Blocks: High-volume, low-range bars suggest institutional activity.
FVG: Gaps between close and open indicate imbalance to be filled.
BOS & Sweeps: Price breaking key levels signals momentum or stop-hunting.
Bias: 1H MA filters trades by broader trend.
Chart Setup
Displays order blocks (teal boxes), pivot (orange), open (purple), bias (colored background), BOS/sweeps (triangles), and signals (labels). Keep other indicators off for clarity.

Smart Money Setup 03 [TradingFinder] Minor OB & Trend Proof🔵 Introduction
The "Smart Money Concept" transcends mere technical trading strategies; it embodies a comprehensive philosophy elucidating market dynamics. Central to this concept is the acknowledgment that influential market participants manipulate price actions, presenting challenges for retail traders.
As a "retail trader", aligning your strategy with the behavior of "Smart Money," primarily market makers, is paramount. Understanding their trading patterns, which revolve around supply, demand, and market structure, forms the cornerstone of your approach. Consequently, decisions to enter trades should be informed by these considerations.
🟣 Important Note
In this setup, pattern formation revolves around the robustness of the "Stop Hunt" targeting retail traders.
When this stop hunt occurs, if the price tests below the minor pivot or above the minor pivot, a "Minor Order Block" is formed.
Similarly, if the price tests below the major pivot or above the major pivot, a "Major Order Block" is formed.
Since the price hasn't successfully broken the major pivots before breaking the Top or Bottom, it can be inferred that the minor pivots formed within a leg of price movement exhibit a "Range" structure.
For a deeper comprehension of this setup, refer to the accompanying visual aids below.
Bullish Setup Details :
Bearish Setup Details :
🔵 How to Use
Upon integrating the indicator into your chart, exercise patience as you await the evolution of the trading setup.
Experiment with different trading positions by adjusting both the "Time Frame" and "Pivot Period". Typically, setups materializing over longer "Time Frames" and "Pivot Periods" carry heightened validity.
Bullish Setup Details on Chart :
Bearish Setup Details on Chart :
Within the settings, you possess the flexibility to modify the "Pivot Period" input to tailor the indicator to your preferences.
